Graphs Panel

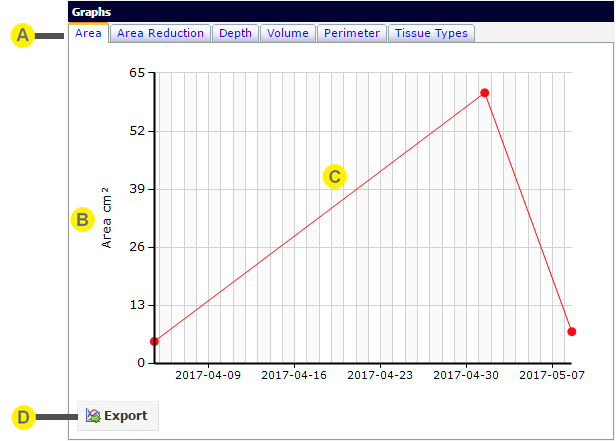
The Graphs panel shows the graphs of wound area, area reduction, depth, and volume for the currently selected wound.

Graph types

There are up to six tabs, one for each of the types of graph available, namely area, area reduction, depth, perimeter, volume, and tissue types.

The graphs available depend on the information available for the wound, and any organization settings that may prevent certain measurements from being displayed.

Legend

The legend indicates the units for the values plotted on the graph.

Graph

The graph plots data for the currently selected wound across all assessments.

If there is no data for the graph type selected, no image will be displayed.

Export

Click on the Export button to export the graph.